Building a Cost-Aware Server & Service Monitoring App
Introduction
Imagine waking up to find that one of your highest revenue-generating pages has quietly gone down for an entire hour... and it cost you thousands of dollars in lost revenue. Ouch! Sadly, this can happen when multiple services or tools don't communicate effectively, leaving you in the dark. This is where our cost-aware monitoring application comes in. It’s designed to consolidate health and cost status from tools like Prometheus, Grafana, and Sentry into a single, unified dashboard.
In this blog, I'll walk you through the design and reasoning behind this application. You’ll see how we’re connecting various servers, gleaning real-time status of our business-critical pages, and preventing cost spikes before they sabotage our bottom line.
Why This App Matters
- Single Source of Truth: No more juggling between multiple dashboards. All data—status, costs, and alerts—live in one place.
- Cost Awareness: CEOs (and the finance team) love it when we can track exact costs and prevent unexpected spikes.
- Service Connectivity: Each page depends on multiple services. Our app ensures each service is running smoothly so the page can continue to generate revenue.
- Proactive Alerting: By correlating status data with cost information, we can stop minor issues from ballooning into big emergencies.
We aim to unify the power of Grafana, Prometheus, and Sentry alongside our custom cost-tracking module so we can keep everything in check without having to jump from one system to another.
Design at a Glance
Penpot Sketches
To start the design, I used Penpot. It’s free, easy to share with the team, and gets the job done when it comes to mapping out user interfaces. Below are screenshots (or references) to the main screens:
-
Setting Screen
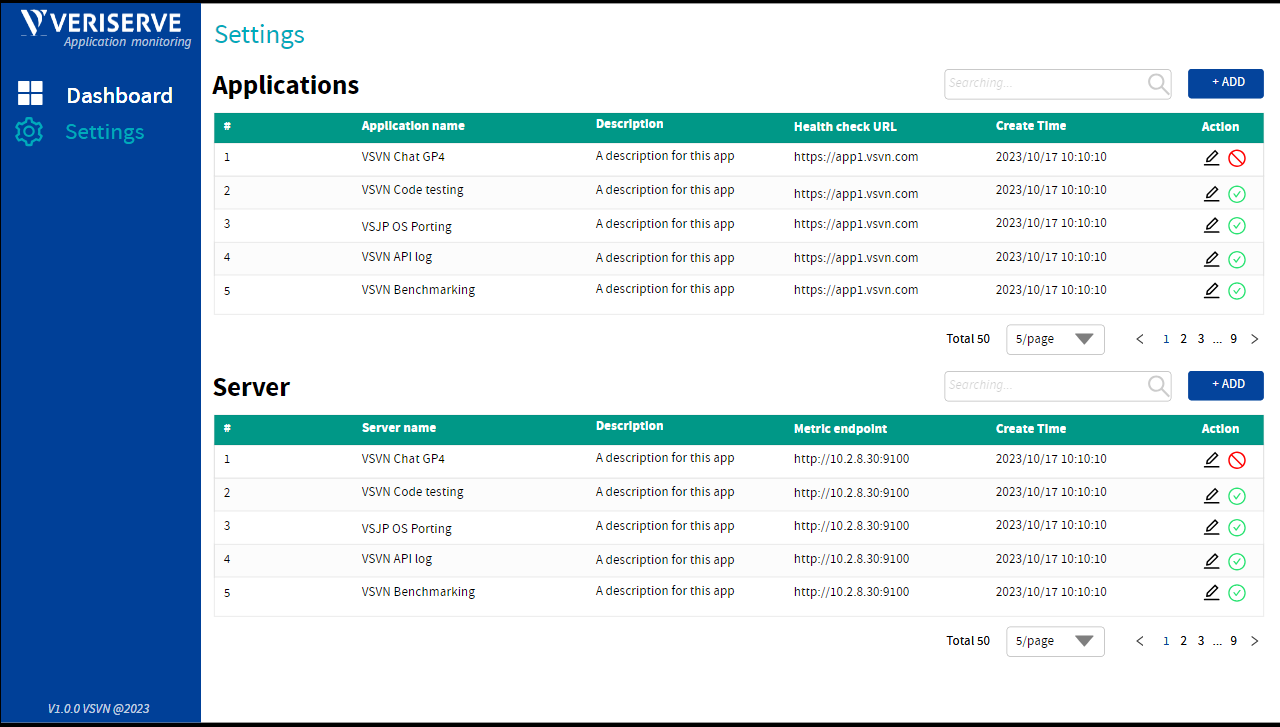
This screen allows us to configure essential parameters—such as API keys, cost thresholds, and page endpoints—so the application knows exactly what to watch and when to raise alarms. -
Dashboard Screen
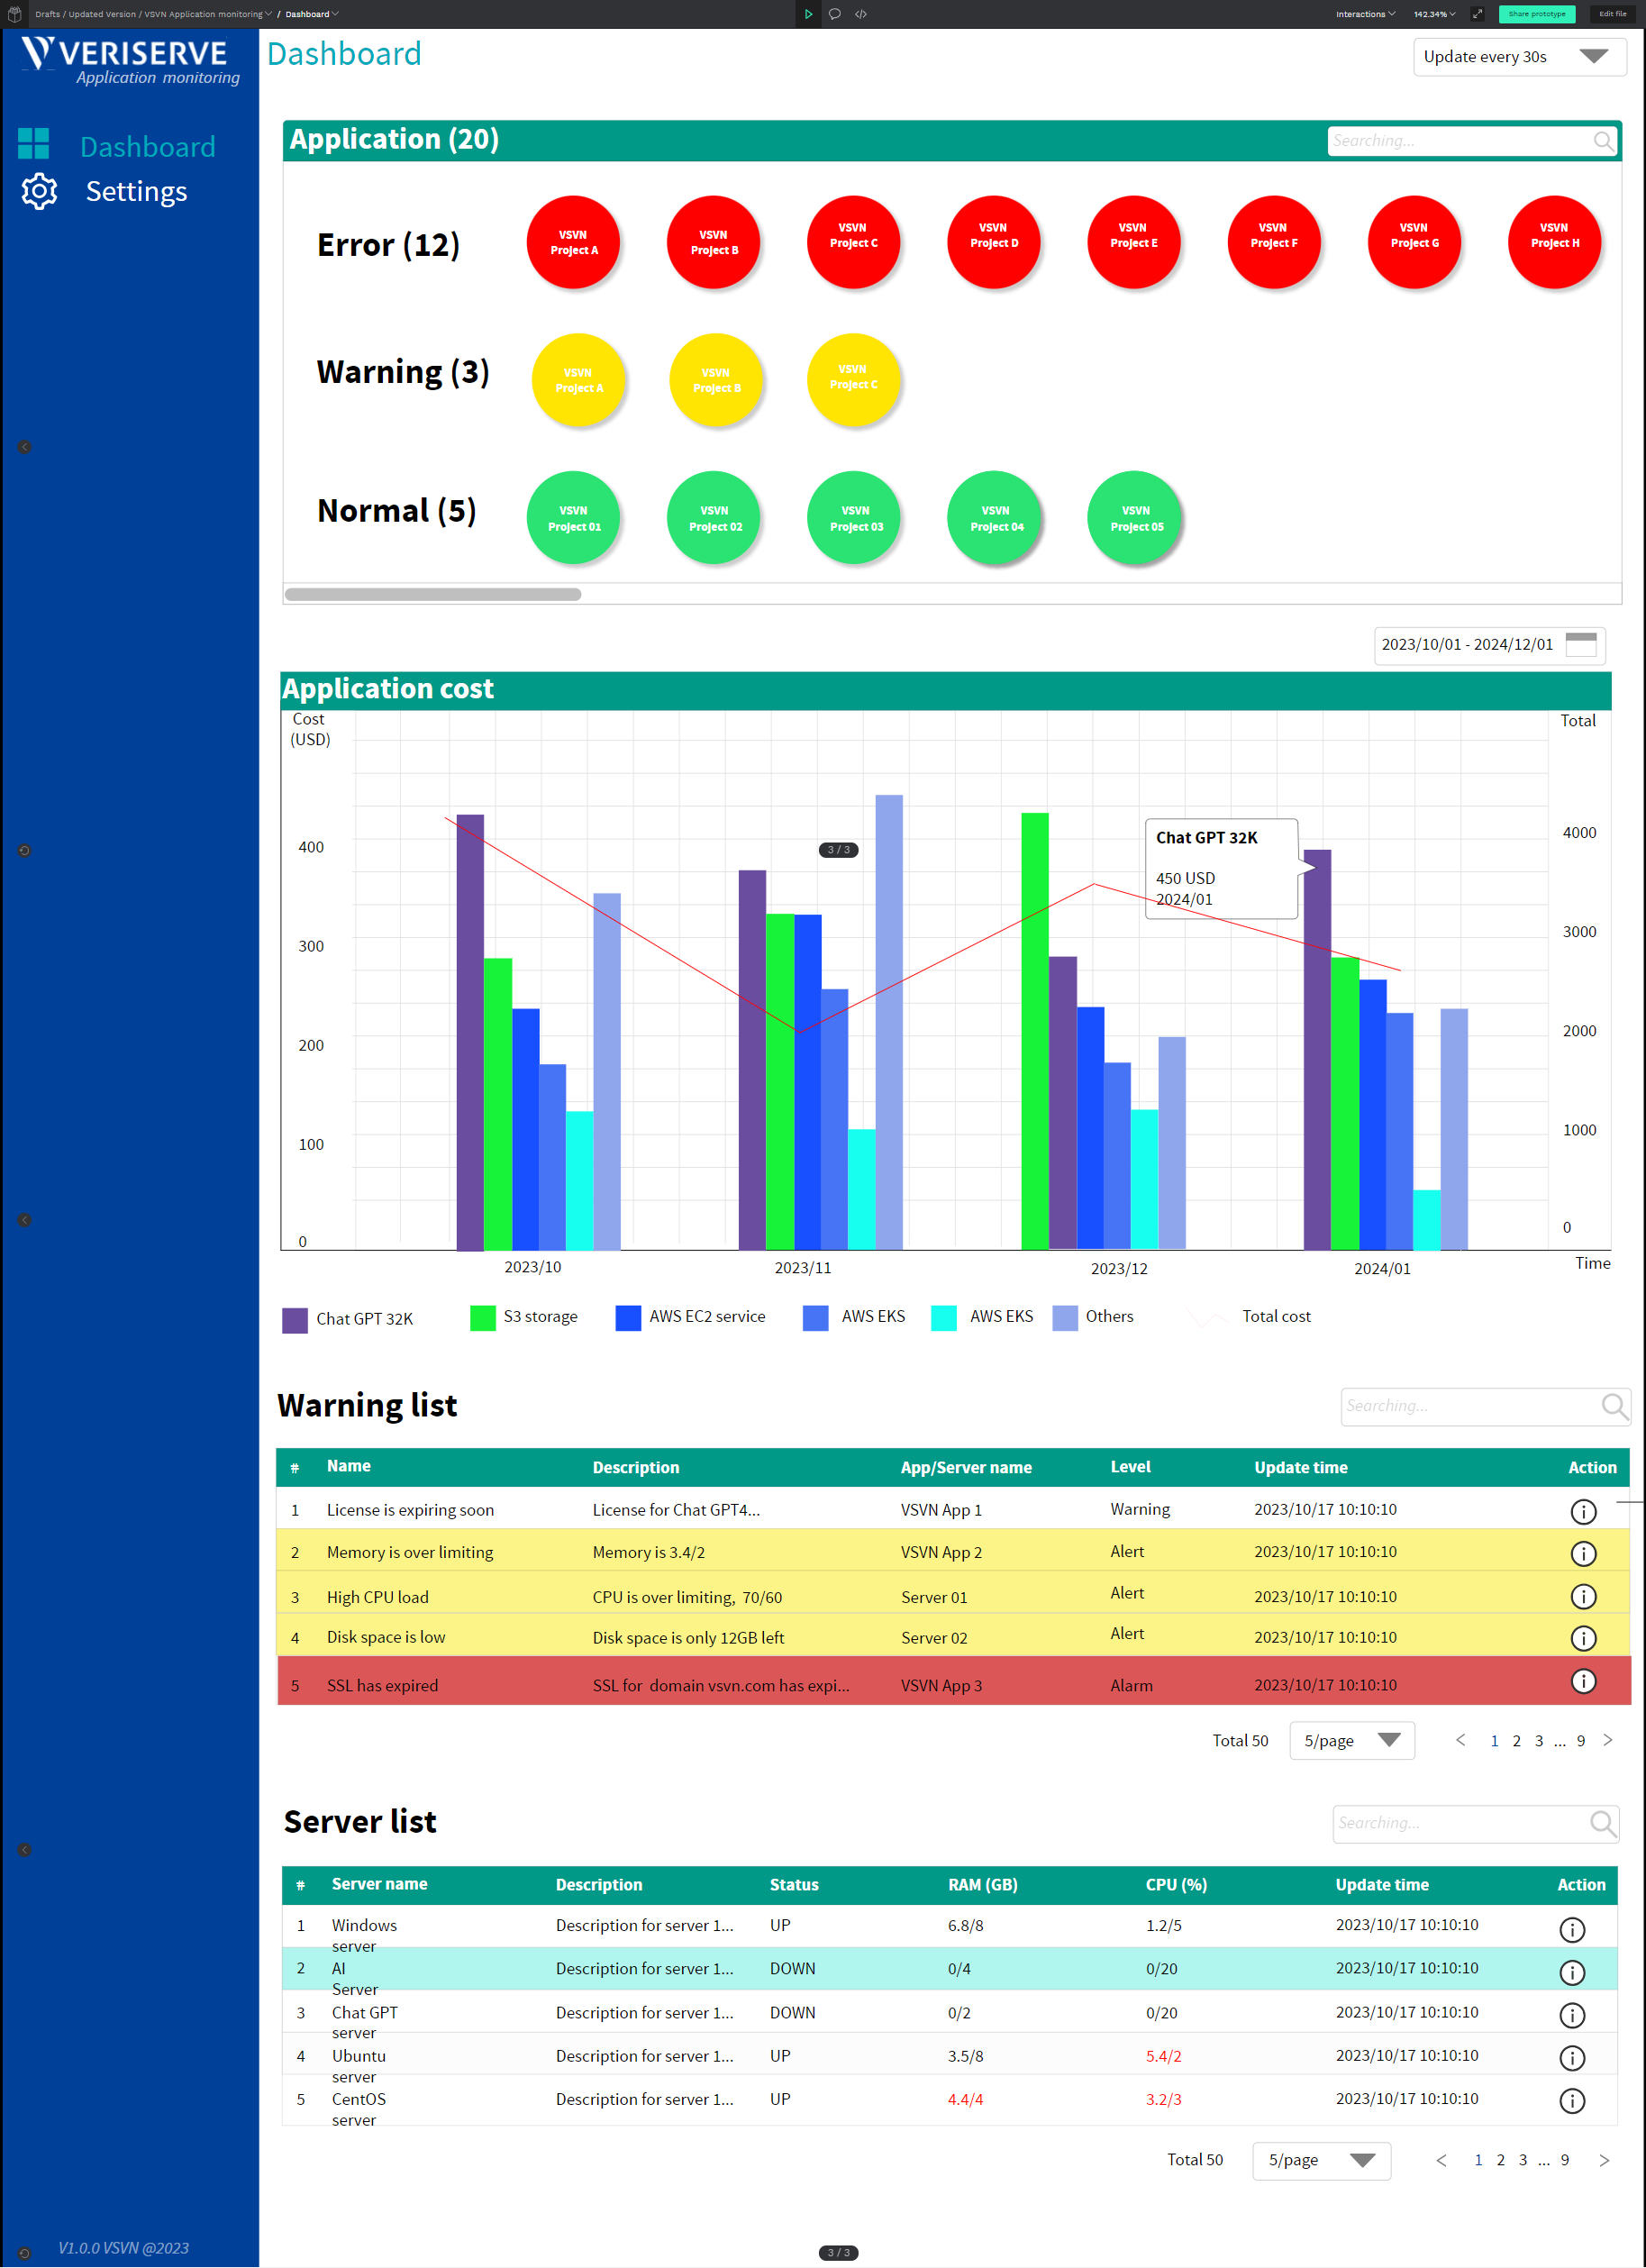
The heart of our application, where you see the overall status of each page and its connected services. Quick-glance widgets reveal if the page is up, if costs are within expected limits, and if there are any alerts from Prometheus or Sentry. -
Application Details Screen
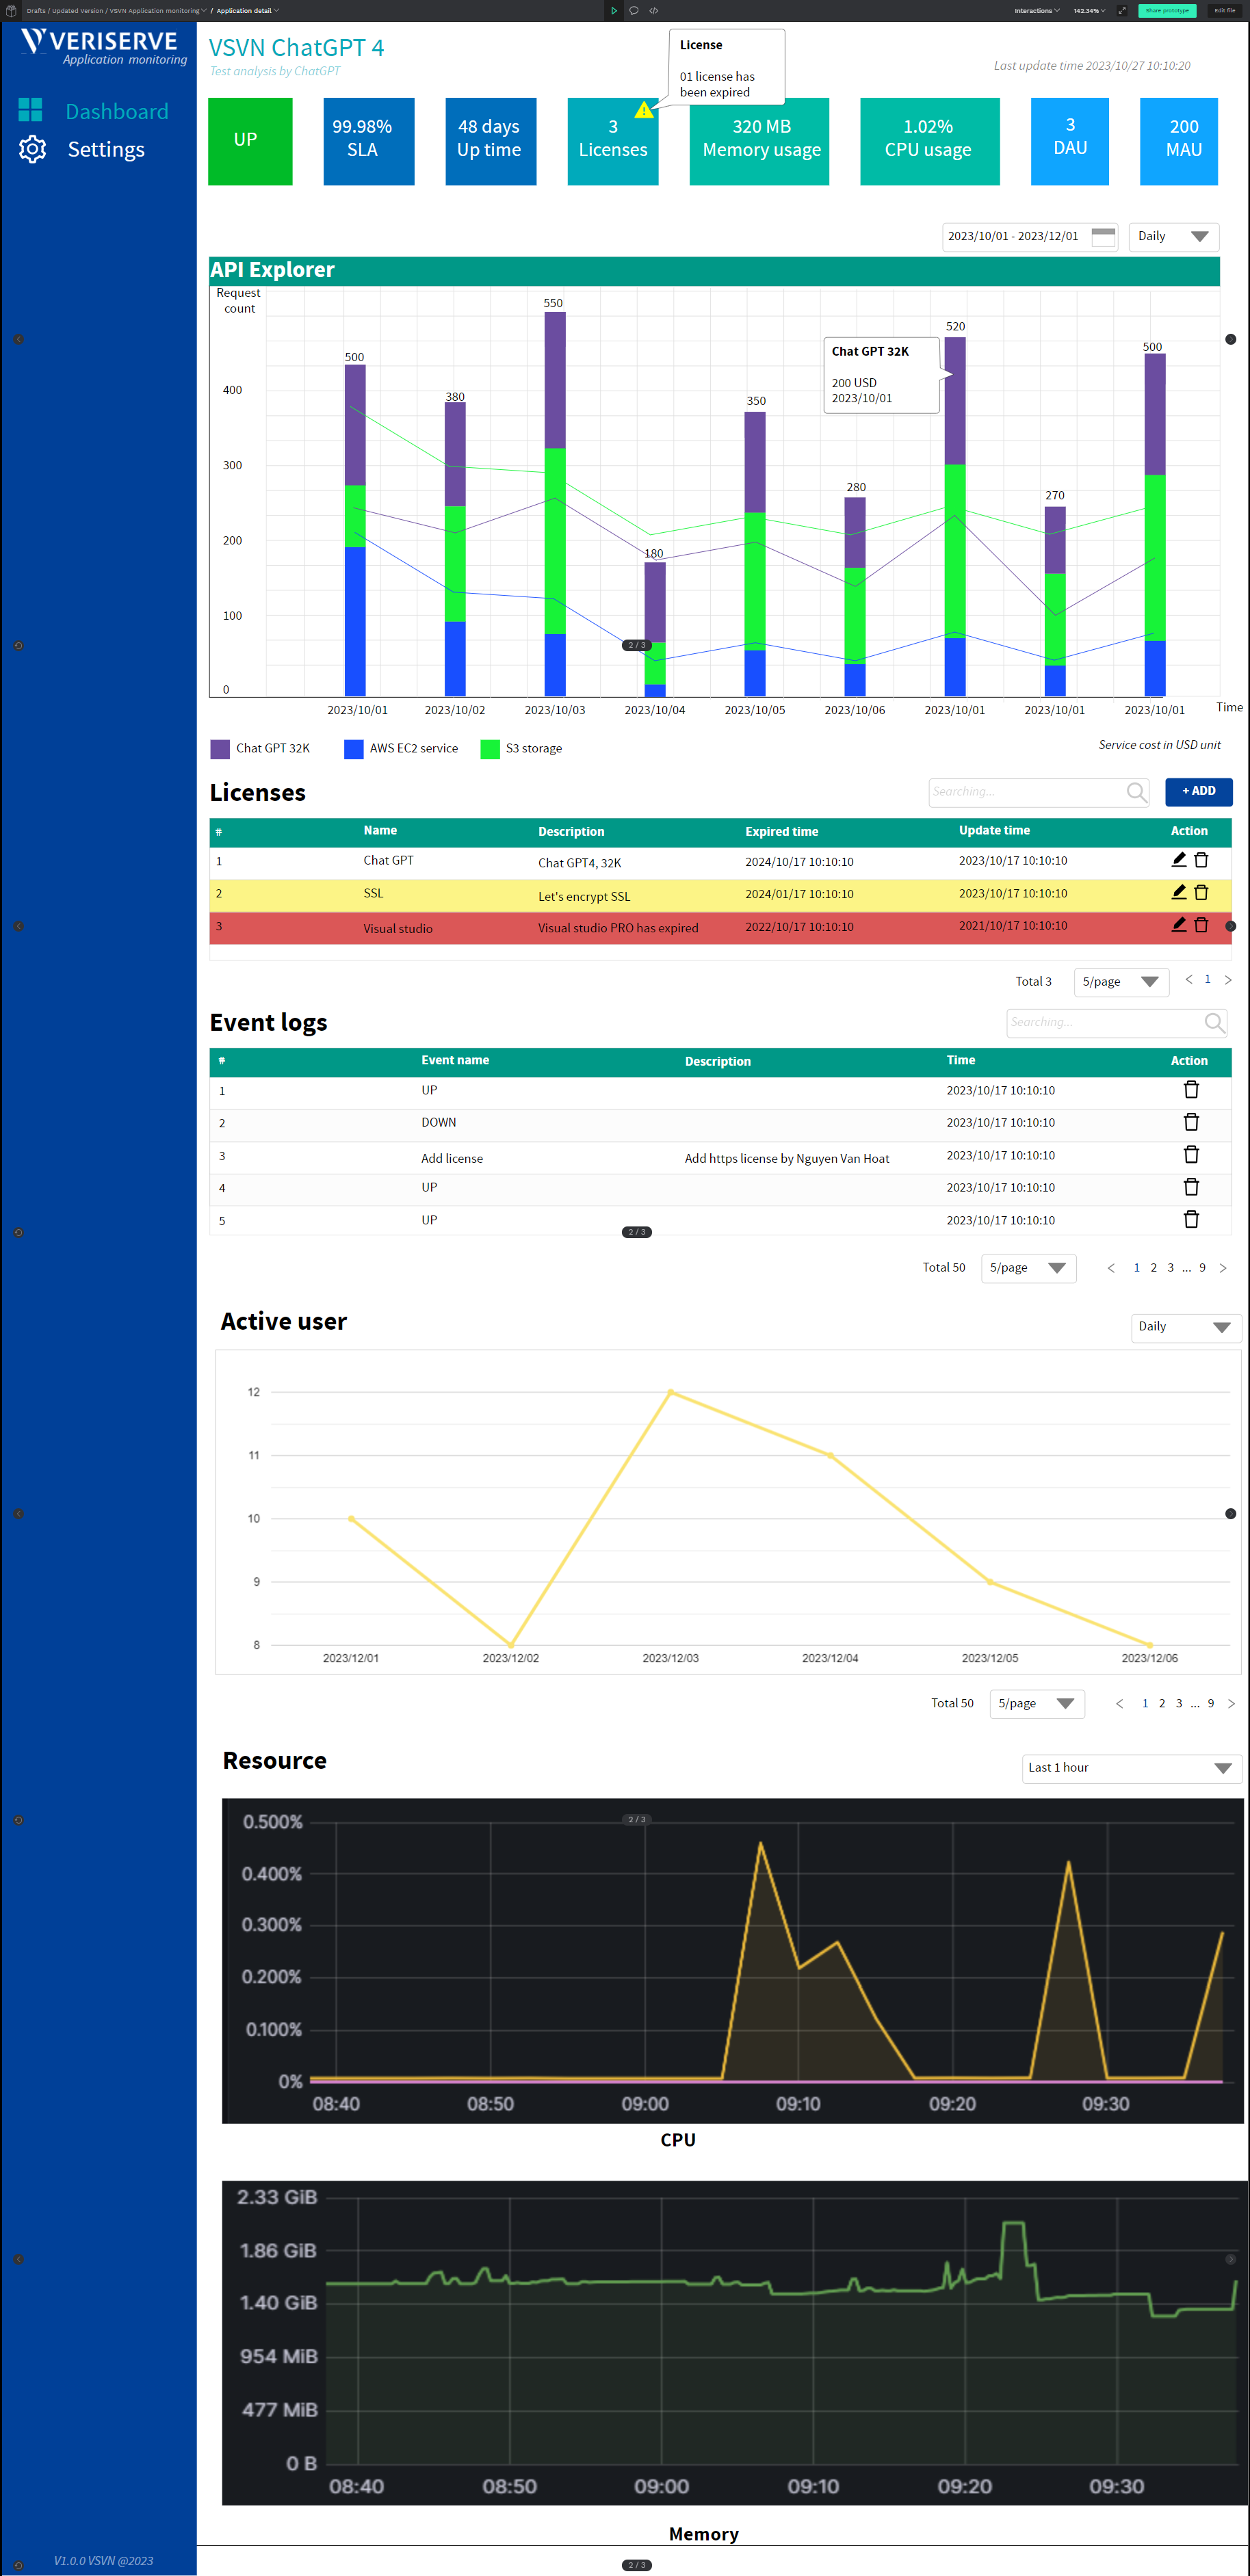
This screen dives deeper into an individual application or page. Here, you’ll find specific performance metrics, connected microservices, and a cost breakdown per service. It’s like a microscope for your revenue-generating beast.
The Architecture
Communication Between Servers
We decided on a built-in agent approach. Instead of deploying heavy monitoring software across all our servers, we have:
- One physical laptop (or a lightweight machine) sitting on our VPN.
- It continuously pings the endpoints and services, collecting data on whether they’re up or down.
- It also polls cost data (either from a billing API or usage logs).
- All this data is aggregated and displayed on the central dashboard.
Because this laptop is on the same network (through the VPN), it can securely talk to all the relevant machines without complicated network setups.
Data Flow
- Services & Endpoints: Report their status or are actively polled by the agent.
- Agent: Stores statuses, metrics, and cost info locally (or in a lightweight database).
- Dashboard: Fetches that data, processes it, and displays everything on easy-to-read charts and tables.
We keep it simple, focusing on the most critical data:
- Service uptime.
- Connected dependencies status.
- Monthly cost usage.
Setting Up the Agent
- Installation: A small script that you run on your central laptop.
- Configuration: Provide IP addresses or hostnames of servers, plus any authentication tokens needed for Prometheus, Grafana, or Sentry.
- Scheduling: The agent runs checks at defined intervals (for example, every minute or every five minutes).
- Data Push/Pull: The agent can either push data to a local database or have the dashboard pull from it. We chose a push model for simplicity.
By using a simple agent, we keep the overhead low and avoid the complexity of setting up a separate infrastructure just for monitoring tasks.
The Dashboard in Action
When you open the dashboard (see  above), you get:
- Traffic Light Indicators: Green means up, orange might mean partial issues, red indicates downtime.
- Cost Gauge: A bar showing how close you are to your monthly cost threshold.
- Alerts: Pulled in from Sentry or Prometheus. For instance, if memory usage is abnormally high, or a 5xx error rate spikes, you'll see an alert here.
All these components are aggregated under the “Overview” panel so you can see at a glance if (a) the page is active, (b) its services are functioning, and (c) the cost is on track.
Application Details
Drilling down into a specific application reveals:
- Individual Microservice Status: Database, APIs, external integrations (like payment gateways).
- Detailed Cost Breakdown: Monthly usage cost, how it stacks over time, and possible reasons for any spike.
- Historical Graphs: Graphs of uptime/downtime events, CPU usage, and cost fluctuations.
This is incredibly useful if you suspect a single microservice is causing a cost spike or if you want to see the direct correlation between uptime and revenue.
Why Simplicity Works
We intentionally chose a minimalistic approach:
- Reuse existing tools (Grafana, Prometheus, Sentry) for robust metrics and alerts.
- Build a straightforward agent for data gathering to keep complexity low.
- Centralize the display so we don’t need to log into each tool individually.
Result? A single, clean interface that keeps your services in line, your budget under control, and your finance team happy.
The Future & Final Thoughts
We’ve taken a critical first step toward ensuring that no more thousands of dollars slip through the cracks because of an unnoticed downtime or cost overrun. CEOs, developers, and finance folks all appreciate having a single pane of glass to monitor and manage what matters most: status and cost.
In the future, we might expand this application to:
- Integrate with Slack or Teams for real-time notifications.
- Include predictive analytics (machine learning) to forecast cost trends.
- Offer a more detailed role-based access system to tailor views for different teams.
For now, we are excited about how this foundational version saves money, reduces stress, and puts monitoring data right where we need it. And yes, the result was great—so give it a try, and let us know what you think!